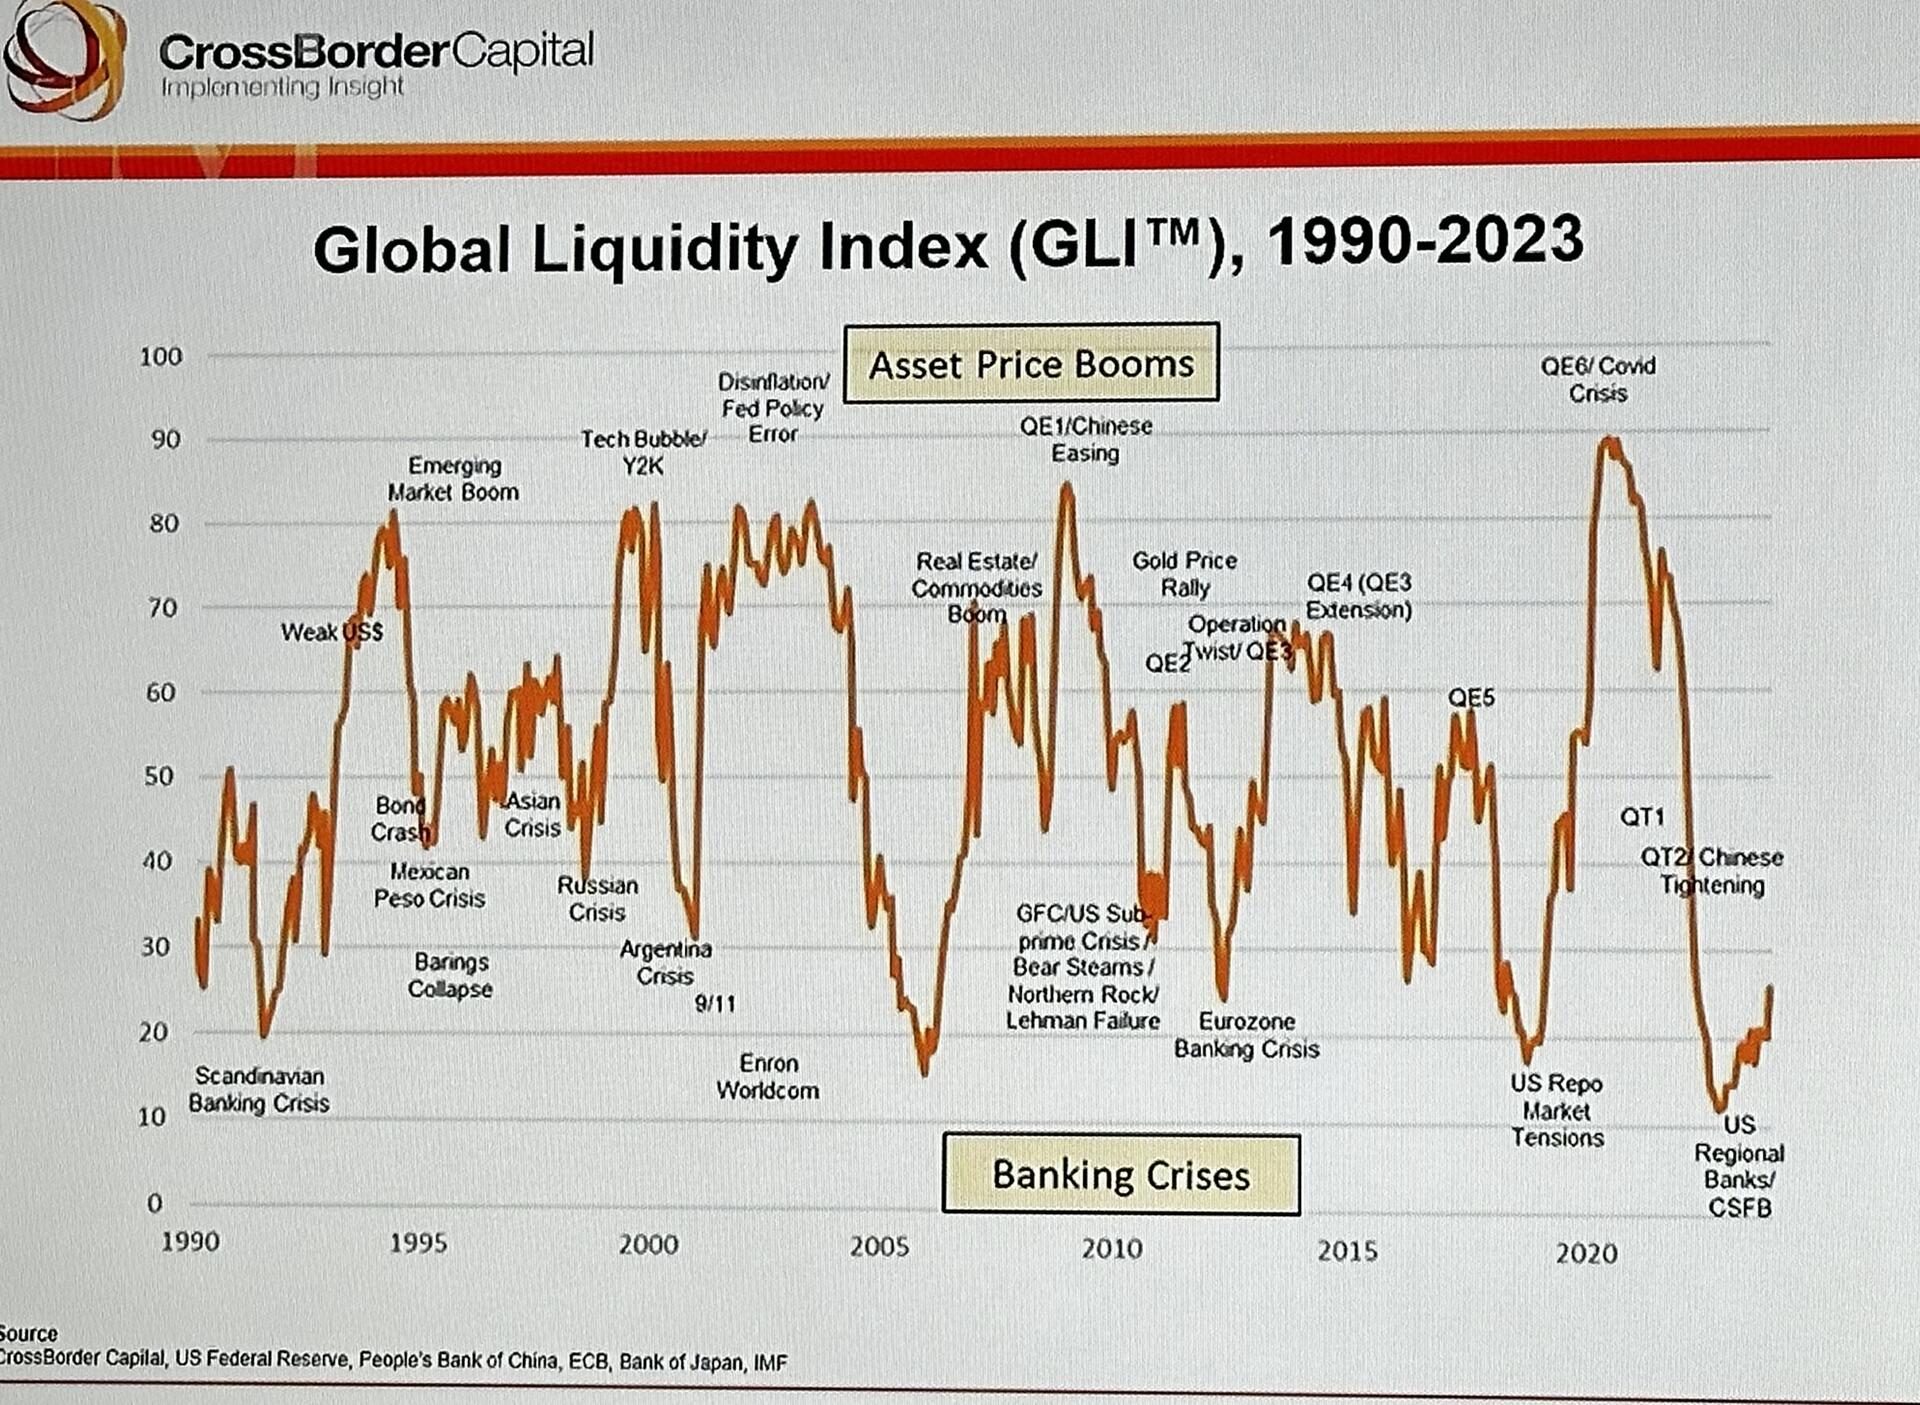
Mike · 106w This is incredibly interesting: 🧐 Here is a fourier sine wave that shows global liquidity cycles, that peak every 65 months (5.4 years). The sine curve fitting used data from 1970-2000, meaning t... Mike @Mike 1707354438 More zoomed in. Shows where asset prices inflate and at lows banking crisis happen - things break!